Nashville multifamily real estate is consistently supported by healthy population growth in the area. According to World Population Review, the population in Nashville has grown steadily between 1.4% and 2.0% year-over-year during the last decade. It also has been touted as one of the top markets for job growth in the country during the last decade. These factors provide a solid foundation for the multifamily market and multifamily real estate investors alike.
Archwest Capital gathers the latest multifamily real estate statistics in Nashville each quarter covering the top stats for multifamily property cap rates, rentals, sales, and construction statistics.
Within the Nashville multifamily report, we also cover the capital market stats with the latest asset value, sales volume, cap rates, and real estate buyer / owner information.
Nashville Multifamily Real Estate Market Stats
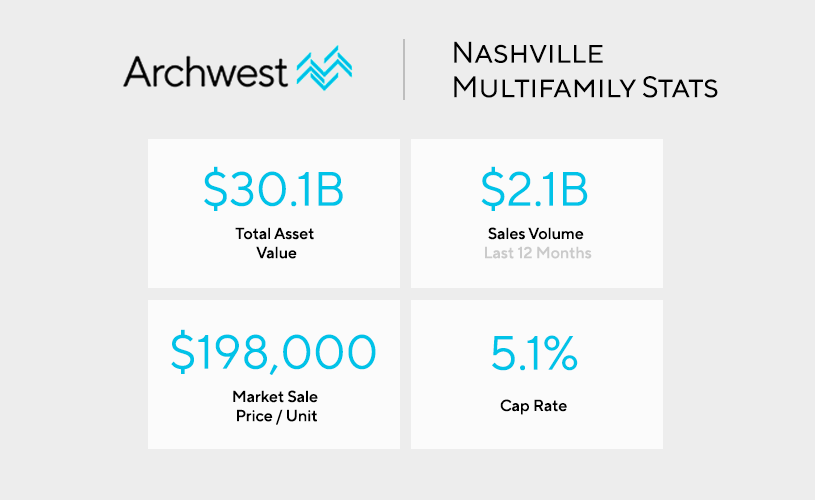
The total asset value of Nashville’s multifamily real estate market is currently $30.1B. The sales volume during the last year was a bit over $2B at $2.1B total with an average sale price per unit of $198K. The cap rate of Nashville multifamily real estate is currently 5.1%.
Total Asset Value: $30.1B
Sales Volume (Last 12 Months): $2.1B
Market Sale Price / Unit: $198,000
12 Month Market Sale Price / Unit: 8.5%
Cap Rate: 5.1%
Nashville Multifamily Real Estate Sales Volume by Buyer Type & Origin (Past 12 Months)
Below are the respective buyer types and their origins vis-a-vis being a local, national, or international buyer of multifamily property in Nashville.
Buyer Type:
Private: 58%
User: <1%
Institutional: 15%
Private Equity: 14%
REIT / Public: 12%
Buyer Origin:
Local: 5%
National: 95%
Foreign: 0%
Nashville Multifamily Real Estate Asset Value by Owner Type & Origin (Past 12 Months)
Below are the respective owner types and their origins vis-a-vis being a local, national, or international owner of multifamily property in Nashville.
Owner Type:
Private: 53%
User: 9%
REIT / Public: 16%
Institutional: 17%
Private Equity: 5%
Owner Origin:
Local: 33%
National: 63%
Foreign: 4%
Top Nashville Multifamily Real Estate Property Statistics
The total amount of multifamily unit deliveries over the past 12 months in Nashville is 5,272 with a net absorption of 7,926 units. The average vacancy rate of all multifamily properties in the area is 6.6% with a 12 month rent growth of 10.1%.
12 Month Deliveries (Units): 5,272
12 Month Net Absorption (Units): 7,926
Vacancy Rate: 6.6%
12 Month Rent Growth: 10.1%
Key Indicators for Multifamily Properties in Nashville Based on Rating
4 & 5 Star
Units: 60,556
Vacancy Rate: 7.9%
Asking Rent: $1,704
Absorption Units: 207
Delivered Units: 0
Under Construction Units: 7,672
3 Star
Units: 49,090
Vacancy Rate: 6.0%
Asking Rent: $1,249
Absorption Units: 113
Delivered Units: 0
Under Construction Units: 5,900
1 & 2 Star
Units: 26,344
Vacancy Rate: 4.7%
Asking Rent: $1,054
Absorption Units: -2
Delivered Units: 0
Under Construction Units: 0
Nashville Multifamily Sales Statistics (Past 12 Months)
Nashville had 71 total multifamily properties exchange hands over the last year. The average price for the properties was $31.7M with an average sale of $198K / unit. The average vacancy of the multifamily properties sold was 10.0% at the time of sale.
Sales Comparables: 71
Average Price / Unit: $198,000
Average Price of Multifamily Property: $31,700,000
Average Vacancy at Sale: 10.0%
Top Nashville Multifamily Property Sales (Past 12 Months)
The Top 5 Multifamily Transactions in Nashville are listed below. They are ranked by the total dollar amount involved in the transaction.
1) *Rating: 5
Year Built: 2016
Units: 431
Vacancy: 1.6%
Price (Unit): $157,943,500 ($366,458)
Price / SF: $217
2) *Rating: 4
Year Built: 2015
Units: 393
Vacancy: 4.3%
Price (Unit): $130,351,037 ($331,682)
Price / SF: $202
3) *Rating: 4
Year Built: 1997
Units: 598
Vacancy: 6.4%
Price (Units): $127,000,000 ($212,374)
Price / SF: $187
4) *Rating: 4
Year Built: 2020
Units: 342
Vacancy: 52.6%
Price (Unit): $105,000,000 ($307,017)
Price / SF: $398
5) *Rating: 3
Year Built: 1987
Units: 468
Vacancy: 3.9%
Price (Units): $100,000,000 ($213,675)
Price / SF: $268
*Rating is 1-5, 5 being the best
Nashville Multifamily Construction Projects Stats
Nashville currently has 57 active multifamily properties under construction bringing an aggregate of 13,572 new units to the area. This represents 10.0% of the current multifamily inventory in Tennessee’s capital.
Properties Currently Under Construction: 57
Total Amount of Multifamily Units: 13,572
Percent of Inventory: 10.0%
Average # of Units: 238
Top Nashville Multifamily Projects Under Construction
The Top 5 Multifamily Projects Under Construction in Nashville are listed below. They are ranked by the amount of units added to the total multifamily real estate inventory.
1) Rating*: 4
Units: 400
Stories: 5
Project Completion: Q1 2023
2) Rating*: 3
Units: 398
Stories: 5
Project Completion: Q2 2022
3) Rating*: 4
Units: 384
Stories: 4
Project Completion: Q4 2022
4) Rating*: 4
Units: 380
Stories: 20
Project Completion: Q2 2023
5) Rating*: 4
Units: 364
Stories: 4
Project Completion: Q3 2021
*Rating is 1-5, 5 being the best
Data Sources: Archwest Capital & CoStar
Nashville, TN Multifamily Loan Products
Archwest Capital’s commercial real estate experts provide multifamily market insights in Nashville with the statistics above, and also have access to various financing options. Learn more about Archwest Capital’s Tennessee Multifamily Loan Products here. Our team is happy to help with any questions you may have regarding potential multifamily investments in Tennessee.