The Inland Empire (also known as I.E.) is situated just east of Los Angeles County, and it consists of the urban and metro areas located in and near San Bernardino and Riverside. The Inland Empire in California is experiencing healthy population growth. Over the last ten years, specifically, it has seen an influx of new residents. Many of the new residents actually come from Los Angeles, as people are shift to “more affordable” markets.
Archwest Capital gathers the latest multifamily real estate statistics in Inland Empire each quarter covering the top stats for multifamily property cap rates, rentals, sales, and construction statistics.
Within the Inland Empire multifamily report, we also cover the capital market stats with the latest asset value, sales volume, cap rates, and real estate buyer / owner information.
Inland Empire Multifamily Capital Market Stats
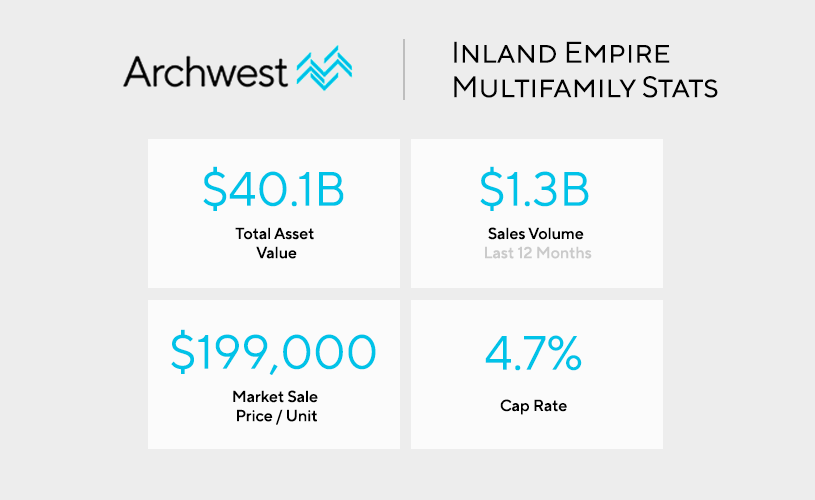
The total asset value of Inland Empire’s multifamily real estate market currently stands at $40.1B. The sales volume during the last year nearly reached $1.5B at $1.3B total with an average sale price per unit of $199K. The cap rate of Inland Empire multifamily real estate is currently 4.7%.
Total Asset Value: $40.1B
Sales Volume (Last 12 Months): $1.3B
Market Sale Price / Unit: $199,000
12 Month Market Sale Price / Unit: 14.2%
Cap Rate: 4.7%
Inland Empire Multifamily Real Estate Sales Volume by Buyer Type & Origin (Past 12 Months)
Buyer Type:
Private: 70%
User: 4%
Institutional: 15%
Private Equity: 11%
Buyer Origin:
Local: 7%
National: 92%
Foreign: 1%
Inland Empire Multifamily Real Estate Asset Value by Owner Type & Origin (Past 12 Months)
Owner Type:
Private: 65%
User: 11%
REIT / Public: 6%
Institutional: 12%
Private Equity: 6%
Owner Origin:
Local: 23%
National: 76%
Foreign: 1%
Top Inland Empire Multifamily Real Estate Property Statistics
The total amount of multifamily unit deliveries over the past 12 months in Inland Empire is 1,172 with a net absorption of 5,515 units. The average vacancy rate of all multifamily properties in the area is 2.4% with a 12 month rent growth of 12.2%.
12 Month Deliveries (Units): 1,172
12 Month Net Absorption (Units): 5,515
Vacancy Rate: 2.4%
12 Month Rent Growth: 12.2%
Key Indicators for Multifamily Properties in Inland Empire Based on Rating
4 & 5 Star
Units: 34,602
Vacancy Rate: 4.3%
Asking Rent: $2,208
Absorption Units: 243
Delivered Units: 521
Under Construction Units: 781
3 Star
Units: 71,349
Vacancy Rate: 1.5%
Asking Rent: $1,730
Absorption Units: 18
Delivered Units: 15
Under Construction Units: 210
1 & 2 Star
Units: 60,535
Vacancy Rate: 2.4%
Asking Rent: $1,185
Absorption Units: -6
Delivered Units: 0
Under Construction Units: 0
Inland Empire Multifamily Sales Statistics (Past 12 Months)
Inland Empire had 162 total multifamily properties exchange hands over the last year. The average price for the properties was $7.6M with an average sale of $199K / unit. The average vacancy of the multifamily properties sold was 3.2% at the time of sale.
Sales Comparables: 162
Average Price / Unit: $199,000
Average Price of Multifamily Property: $7,600,000
Average Vacancy at Sale: 3.2%
Top Inland Empire Multifamily Property Sales (Past 12 Months)
1) *Rating: 4
Year Built: 2018
Units: 346
Vacancy: 6.7%
Price (Unit): $128,000,000 ($369,942)
Price / SF: $331
2) *Rating: 3
Year Built: 1986
Units: 556
Vacancy: 1.1%
Price (Unit): $125,000,000 ($224,820)
Price / SF: $199
3) *Rating: 2
Year Built: 1987
Units: 412
Vacancy: 1.0%
Price (Units): $93,750,000 ($227,548)
Price / SF: $307
4) *Rating: 3
Year Built: 1986
Units: 352
Vacancy: 3.7%
Price (Unit): $88,000,000 ($250,000)
Price / SF: $290
5) *Rating: 4
Year Built: 2019
Units: 230
Vacancy: 0.4%
Price (Units): $78,250,000 ($340,217)
Price / SF: $297
*Rating is 1-5, 5 being the best
Inland Empire Multifamily Construction Projects Stats
Inland Empire currently has 10 active multifamily properties under construction bringing an aggregate of 991 new units to the area. This represents 0.6% of the current multifamily inventory in Inland Empire, California.
Properties Currently Under Construction: 10
Total Amount of Multifamily Units: 991
Percent of Inventory: 0.6%
Average # of Units: 99
Top Inland Empire Multifamily Projects Under Construction
1) Rating*: 4
Units: 186
Stories: Not Listed
Project Completion: Q4 2021
2) Rating*: 5
Units: 165
Stories: 7
Project Completion: Q2 2021
3) Rating*: 3
Units: 160
Stories: 3
Project Completion: Q3 2021
4) Rating*: 4
Units: 142
Stories: 2
Project Completion: Q2 2021
5) Rating*: 4
Units: 125
Stories: Not Listed
Project Completion: Q2 2021
*Rating is 1-5, 5 being the best
Data Sources: Archwest Capital & CoStar
Inland Empire, CA Multifamily Loan Products
Archwest Capital’s commercial real estate experts provide multifamily market insights in Inland Empire with the statistics above, and also have access to various financing options. Learn more about Archwest Capital’s California Multifamily Loan Products here. Our team is happy to help with any questions you may have regarding potential multifamily investments in California.