What Are the Top Multifamily Markets by Rent Growth in 2021?
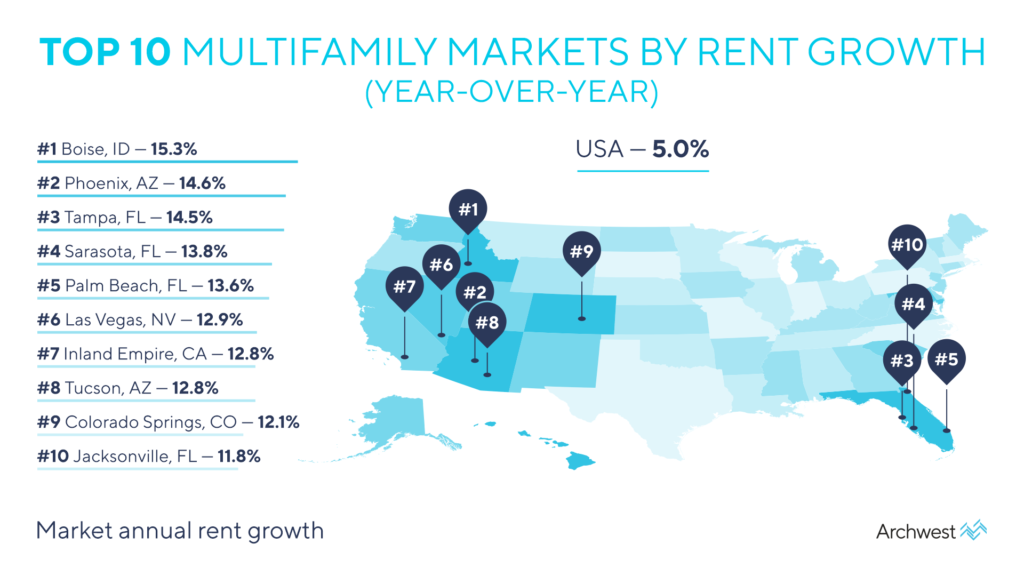
We put together a list of the Top 10 Multifamily Markets by Rent Growth in the United States taking into consideration rent growth year-over-year as the primary driver. We then provided each market’s annual rent growth, vacancy rate, and market asking rent / unit. Along with these data points, we’ve also included each multifamily market’s total population, population growth, the current median household, median household income growth, cap rate, and the total asset value in each location.
Before diving into the Top Multifamily Markets by rent growth, we’ve gathered the aforementioned stats for the National Multifamily Market in order to give some perspective and comparison to the demographic and economic stats below.
National Multifamily Market Statistics
The annual rent growth across the United State was 5% year-over-year while the total population grew 0.2% from 2020 to present. During this time the median household income growth was 7.7% with an average asking rent / unit of $1,445 per month.
Annual Rent Growth (Past 12 Months): 5.0%
Vacancy Rate: 6.0%
Market Asking Rent / Unit: $1,445
Population: 330,057,813
Population Growth (Past 12 Months): 0.2%
Median Household Income: $73,457
Median Household Income Growth (Past 12 Months): 7.7%
Market Cap Rate: 5.4%
Total Multifamily Market Asset Value: $3.9T
Every multifamily market on our list has an annual rent growth that is at least twice as much as the national average. Concurrently the population growth in all of these markets was well above the national average by at least three times.
1) Boise, ID Multifamily Market
Boise, Idaho had an annual rent growth of 15.3% year-over-year, which is three times the national average. During this time vacancy rates stayed at 3.2%, nearly half the national average, and the population growth since 2020 was 2.4%.
Annual Rent Growth (Past 12 Months): 15.3%
Vacancy Rate: 3.2%
Market Asking Rent / Unit: $1,336
Population: 782,561
Population Growth (Past 12 Months): 2.4%
Median Household Income: $73,393
Median Household Income Growth (Past 12 Months): 6.6%
Market Cap Rate: 4.8%
Total Multifamily Market Asset Value: $5.7B
2) Phoenix, AZ Multifamily Market
Phoenix, Arizona had an annual rent growth of 14.6% year-over-year, which is nearly times the national average. During this time vacancy rates were a bit lower than the national average at 5%, and the population growth since 2020 was 1.7%.
Annual Rent Growth (Past 12 Months): 14.6%
Vacancy Rate: 5.0%
Market Asking Rent / Unit: $1,361
Population: 5,116,369
Population Growth (Past 12 Months): 1.7%
Median Household Income: $75,365
Median Household Income Growth (Past 12 Months): 7.7%
Market Cap Rate: 4.5%
Total Multifamily Market Asset Value: $76B
3) Tampa, FL Multifamily Market
Tampa, Florida had an annual rent growth of 14.5% year-over-year, which is also nearly times the national average. During this time vacancy rates were a bit lower than the national average at 5.0%, and the population growth since 2020 was 0.9%.
Annual Rent Growth (Past 12 Months): 14.5%
Vacancy Rate: 5.0%
Market Asking Rent / Unit: $1,439
Population: 3,254,481
Population Growth (Past 12 Months): 0.9%
Median Household Income: $66,282
Median Household Income Growth (Past 12 Months): 10.6%
Market Cap Rate: 5.1%
Total Multifamily Market Asset Value: $36.8B
4) Sarasota, FL Multifamily Market
Sarasota, Florida had an annual rent growth of 13.8% year-over-year, which is also nearly times above the national average. During this time vacancy rates were a bit lower than the national average at 4.7%, and the population growth since 2020 was 1.0%.
Annual Rent Growth (Past 12 Months): 13.8%
Vacancy Rate: 5.6%
Market Asking Rent / Unit: $1,514
Population: 854,841
Population Growth (Past 12 Months): 1.0%
Median Household Income: $74,480
Median Household Income Growth (Past 12 Months): 9.5%
Market Cap Rate: 5.0%
Total Multifamily Market Asset Value: $7.3B
5) Palm Beach, FL Multifamily Market
Palm Beach, Florida had an annual rent growth of 13.6% year-over-year, which is well above the national average. During this time vacancy rates were a bit lower than the national average at 5.8%, and the population growth since 2020 was 0.9%.
Annual Rent Growth (Past 12 Months): 13.6%
Vacancy Rate: 5.8%
Market Asking Rent / Unit: $1,885
Population: 1,525,087
Population Growth (Past 12 Months): 0.9%
Median Household Income: $72,609
Median Household Income Growth (Past 12 Months): 5.5%
Market Cap Rate: 4.7%
Total Multifamily Market Asset Value: $19.8B
6) Las Vegas, NV Multifamily Market
Las Vegas, Nevada had an annual rent growth of 12.9% year-over-year, which is also considerably above the national average. During this time vacancy rates were 1.3$ lower than the national average at 4.7%, and the population growth since 2020 was 1.0%.
Annual Rent Growth (Past 12 Months): 12.9%
Vacancy Rate: 4.7%
Market Asking Rent / Unit: $1,254
Population: 2,324,620
Population Growth (Past 12 Months): 1.0%
Median Household Income: $68,456
Median Household Income Growth (Past 12 Months): 5.1%
Market Cap Rate: 4.9%
Total Multifamily Market Asset Value: $30.2B
7) Inland Empire, CA Multifamily Market
Inland Empire, California had an annual rent growth of 12.8% year-over-year, which is well above the national average. During this time vacancy rates were nearly three times lower than the national average at 2.2%, and the population growth since 2020 was 0.6%.
Annual Rent Growth (Past 12 Months): 12.8%
Vacancy Rate: 2.2%
Market Asking Rent / Unit: $1,719
Population: 4,694,396
Population Growth (Past 12 Months): 0.6%
Median Household Income: $82,937
Median Household Income Growth (Past 12 Months): 11.5%
Market Cap Rate: 4.7%
Total Multifamily Market Asset Value: $39.2B
8) Tucson, AZ Multifamily Market
Tucson, Arizona also had an annual rent growth of 12.8% year-over-year (same as Inland Empire, CA), which is nearly three times the national average. During this time vacancy rates were much lower than the national average at 4.1%, and the population growth since 2020 was 0.7%.
Annual Rent Growth (Past 12 Months): 12.8%
Vacancy Rate: 4.1%
Market Asking Rent / Unit: $943
Population: 1,065,096
Population Growth (Past 12 Months): 0.7%
Median Household Income: $64,014
Median Household Income Growth (Past 12 Months): 9.8%
Market Cap Rate: 5.5%
Total Multifamily Market Asset Value: $9B
9) Colorado Springs, CO Multifamily Market
Colorado Springs, Colorado had an annual rent growth of 12.1% year-over-year, which is also well above the national average. During this time vacancy rates in Colorado Springs were slightly lower than the national average at 5.4%, and the population growth since 2020 was 0.8%.
Annual Rent Growth (Past 12 Months): 12.1%
Vacancy Rate: 5.4%
Market Asking Rent / Unit: $1,301
Population: 757,726
Population Growth (Past 12 Months): 0.8%
Median Household Income: $83,348
Median Household Income Growth (Past 12 Months): 8.9%
Market Cap Rate: 5.0%
Total Multifamily Market Asset Value: $8.4B
10) Jacksonville, FL Multifamily Market
Jacksonville, Florida had an annual rent growth of 11.8% year-over-year, which is also well above the national average. During this time vacancy rates were a bit above the national average at 6.1% (+0.1%), and the population growth since 2020 was 0.9%.
Annual Rent Growth (Past 12 Months): 11.8%
Vacancy Rate: 6.1%
Market Asking Rent / Unit: $1,251
Population: 1,589,789
Population Growth (Past 12 Months): 0.9%
Median Household Income: $77,761
Median Household Income Growth (Past 12 Months): 12.0%
Market Cap Rate: 5.2%
Total Multifamily Market Asset Value: $14.9B
Data Sources: Archwest Capital & CoStar